
Please Note: This article contains several acronyms and technical terms. Please refer to the glossary at the end for definitions, or contact a member of our team for further clarification.
Last quarter we looked at stock and bond performance, the Wall Street Journal (WSJ) Survey of economists, and consumer sentiment surveys, and set out a list of what we then knew and did not know about factors expected to impact future economic conditions in the US. This quarter we will compare changes in the WSJ survey, changes in consumer sentiment, stock and bond performance, and what we know and still don’t know. In addition, we will briefly review the potential economic impact of the “One Big Beautiful Bill”.
Market Performance
The second quarter was good for stocks. The S&P 500 was up 10.6%, DJIA was up 5.0% and NASDAQ was up 17.8%. International stocks were also up 10.8%.
The 10-year U.S. Treasury yield at the close of March 31st was 4.245% and at the close of June 30th it was 4.226%. No significant change.
WSJ July Survey Results
Based on the results of the July survey, economists are less concerned about potential negative economic impacts of President Trump’s trade policies than they were in April. The April survey was conducted at the height of the president’s threats to impose very high tariffs on our major trading partners and some level of tariffs on most every country trading with the U.S. He almost immediately paused implementation. In our Q4 2024 Economic Report we looked at the whipsaw implementation/withdrawal/modification of tariffs imposed in the first Trump administration. It now seems that this is a deliberate negotiating strategy of the president. Where tariffs will end up, we still don’t know. The White House claims that numerous deals have been made with our trading partners, including an agreement signed on May 8, 2025 with the UK and an agreement signed on May 12, 2025 with China that adjusted tariffs for both China and the US for 90 days and set forth a “mechanism” for ongoing economic discussions. Whether or not a final agreement with China will ever exist is unknown.
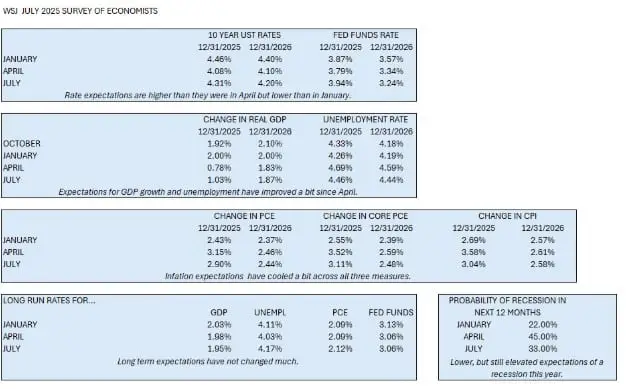
Back to the survey. Please see the updated charts below. What we see are slightly higher predicted rates through 2026 as uncertainty over the inflationary impact of tariffs hangs over us. Two factors are at play in attempting to forecast the impact of tariffs on inflation. First is the on-again, off-again implementation and withdrawals of tariffs. Second is the fact that the full inflationary impact will not be felt until the second half of the year. There was a significant amount of front-ending of orders when the tariffs were first announced and as the economy burns through that lesser tariffed inventory, higher prices may flow through the economy. While the outlook for Real GDP growth, unemployment, and inflation are more optimistic than in the April survey, they remain less optimistic than in the January survey. Long-term outlooks are essentially unchanged, and the probability of a recession dropped from 45% to 33%. Economists seem to be breathing a little easier this quarter, although, as we learned last quarter, economic forecasts are wrong half the time.
Consumer Sentiment
Again, we looked at The Conference Board as well as the University of Michigan surveys of consumer confidence for June.
Conference Board
- Confidence weakened both in the Present Situation Index as well as the Expectations Index.
- Less confidence in current business conditions than in May.
- Appraisal of current job availability weakened for the 6th consecutive month but remains in positive territory. Still a solid labor market.
- All three components of the Expectation Index - business conditions, employment prospects and future income weakened.
- Concerns are over tariffs, inflation and high prices.
- Outlook for stock prices increasing over the next twelve months increased from 37.6% to 45.6%.
- Family’s Current Financial Situation remains solid although some deterioration is noted.
- Expectations of Family Future Financial Situation improved to a four-month high.
University of Michigan Survey
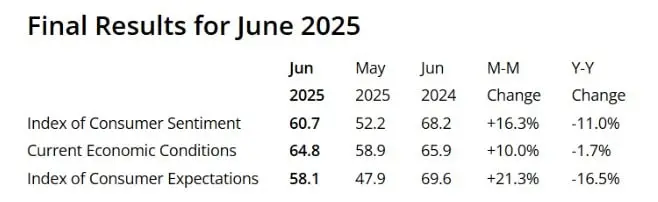
- Consumer Sentiment increased 16.3% from May. First increase in six months.
- Broad based consensus.
- Expectations for Personal Finance and Business Conditions increased by 20%.
- Concern expressed about impact of tariffs.
- Year ahead inflation expectations fell from 6.6% to 5.0%.
“Consumers’ fear about the potential impact of tariffs on future inflation softened somewhat in June”.
Retail Sales for June were down .33% from May but 3.19% higher than June 2024.
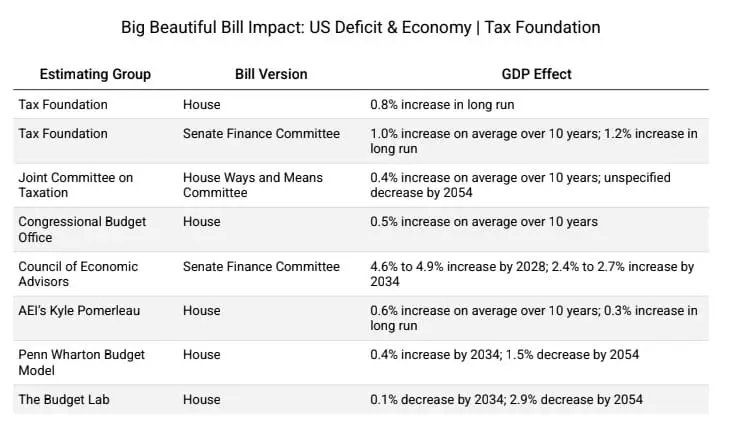
The impact of the One Big Beautiful Bill depends on who you ask. See the chart below for various estimates. It is interesting that seven of the eight responders see the bill as having a positive impact on GDP. Only The Budget Lab of Yale University forecasts a decline in GDP as a result of the passage of this bill. The White House says economic growth will offset the deficit increase and the increase in national debt some forecasters are predicting as a result. While the Budget Lab is predicting a decline in GDP, it is over a ten to twenty-nine year time frame. As we all know, a lot can and will happen over the next ten to twenty years. We will see. I sure hope I am here in 2054 to report back to you!
CURRENT ESTIMATED Q2 DATA
- The Atlanta Fed’s GDPNow estimate for the second quarter is 2.6% as of July 9th.
- Unemployment is 4.1%.
- Core PCE for Q2 is estimated by the Bureau of Economic Analysis to be 2.3% — same as May.
- Core CPI is estimated to be up 3.0% year over year.
These estimates are always revised so don’t consider them gospel.
Conclusions
There has not been a significant change in the economic outlook since our last report. Inflation has not shown a pattern of moving toward the Federal Reserve’s 2.0% goal. Although there is much discussion in the media about potential rate cuts this Fall, the data for cuts does not appear to be present for a data-dependent Federal reserve.
Corporate Earnings
We are still very early in the Q2 2025 Corporate Earnings Season. However, with less than 20% of the S&P 500 reporting, no alarm bells are going off despite concerns about tariffs and trade policies. The year-over-year earnings growth rate as of July 11th was 4.8%, down slightly from the 4.9% reported in the first quarter. The year-over-year revenue growth rate was 4.2% compared to the five-year average of 7.2%. While this represents a significant drop, it still represents real growth over inflation. As the reporting unfolds, we will be following this statistic closely in relation to retail sales and consumer sentiment. While it is too early to reach conclusions, it appears that corporate America remains healthy.
Last quarter we asked the question:
- Where will tariff levels end up? We still don’t know this quarter and we may not know for the remainder of the president’s term. Keeping our trading partners off balance seems to be his negotiating strategy and it may just work.
- What impact will tariffs have on inflation, interest rates, GDP, unemployment? Since we don’t know where tariffs will end up, we can’t begin to answer this question.
- What will the resolution with China look like? All we have so far is an agreement that sets forth a mechanism for future economic discussions.
- How U.S. trade policy will change in the future? Too early to tell.
What we do know is that unemployment is low, consumers are healthy and inflation is not far from the Fed’s target, although moving in the wrong direction. Over the next three weeks we will see how corporate earnings fared in the second quarter. Actually, I feel better than I did in April!
Glossary
The Standard and Poor’s 500, or simply the S&P 500, is a stock market index tracking the stock performance of 500 leading companies listed on stock exchanges in the United States.
The Dow Jones Industrial Average, Dow Jones, or simply the Dow, is a stock market index of 30 prominent companies listed on stock exchanges in the United States. The DJIA is one of the oldest and most commonly followed equity indices.
The NASDAQ (National Association of Securities Dealers Automated Quotations) is a global electronic stock exchange, known for its focus on technology and growth stocks.
PCE stands for Personal Consumption Expenditures. It represents the total spending by individuals and households on goods and services in the U.S. economy. Core PCE excludes food and energy prices. The Federal Reserve favors the PCE (over CPI) because it’s believed to be a more accurate representation of actual consumer spending and tends to show a smoother inflation trend.
Core CPI, or Core Consumer Price Index, is a measure of inflation that excludes food and energy prices.
Gross Domestic Product (GDP) is a monetary measure of the total market value of all the final goods and services produced and rendered in a specific time period by a country or countries. GDP is often used to measure the economic activity of a country or region.
This material is for general information only and is not intended to provide specific advice or recommendations for any individual. There is no assurance that the views or strategies discussed are suitable for all investors or will yield positive outcomes. Investing involves risks including possible loss of principal. Together Planning has a reasonable belief that this marketing does not include any false or material misleading statements or omissions of facts regarding services, investments, or client experiences. Together Planning has a reasonable belief that the content will not cause an untrue or misleading implication regarding the adviser’s services, investments, or client experiences. Any economic forecasts set forth may not develop as predicted and are subject to change. Any references to markets, asset classes, and sectors are generally regarding the corresponding market index. Indexes are unmanaged statistical composites and cannot be invested into directly. Index performance is not indicative of the performance of any investment and do not reflect fees, expenses, or sales charges. All performance referenced is historical and is no guarantee of future results.
Market projections or investment growth, including those in examples, are not indicative of future results, should not be considered specific investment advice, do not take into consideration your specific situation, and do not intend to make an offer or solicitation for the sale or purchase of any securities or investment strategies. Investments involve risk, including changes in market conditions, and are not guaranteed. Be sure to consult with a qualified financial advisor and/or tax professional before implementing any strategy discussed herein. Together Planning is a SEC registered investment advisor.