")

Please Note: This article contains several acronyms and technical terms. Please refer to the glossary at the end for definitions, or contact a member of our team for further clarification.
In our last economic update, we looked at market performance, the Wall Street Journal quarterly survey of economists, consumer sentiment, retail sales and the initial reports of corporate earnings for the second quarter. These same reports for the third quarter of 2025 do not show any significant changes from the second quarter.
Market Performance and Corporate Earnings
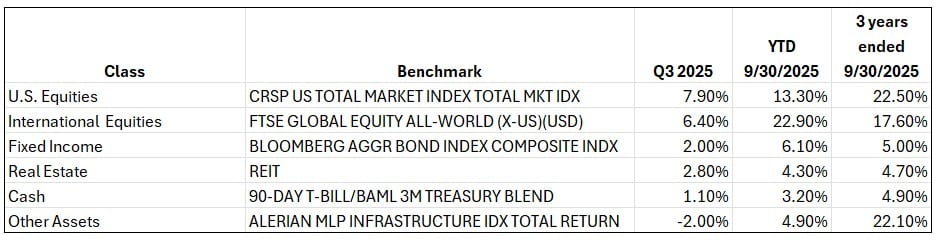
Second quarter corporate earnings were particularly strong with over 80% of reporters beating earnings estimates and over 75% beating revenue estimates. The S&P 500 increased EPS (Earnings Per Share) 12% year over year. The bar for the second quarter may have been set lower because of the uncertainty as to the impact of tariffs. However, this strong trend continued in the third quarter with the EPS beat rate at 87%, EPS growth of 9.2%, and revenue growth of 7.0%. The “Magnificent Seven” (mega-cap tech stocks) continue to drive nearly 40% of the S&P 500 growth. Analysts forecast full year 2025 earnings growth at 11% with 2026 forecasted at 13.9%. In summary, the third quarter underscores US corporate strength with some caution for overreliance on the tech giants. Stocks and bonds performed well in the third quarter. See chart below.
Stock Valuations are High
There has been some discussion in the news regarding stock values as measured by earnings per share multiples. There is no question that current levels are higher than historical averages. The US is continuing the transition into a digitally dominated economy at an accelerated rate, and mega cap tech stocks (“The Magnificent Seven”) are having a dominating effect. Nvidia alone added approximately $26 to S&P EPS in 2024-2025. These mega tech stocks enjoy significantly higher profit margins than other sectors in the S&P. For example, software/subscription models enjoy gross profit margins from 70% to 90%. If you define the “old economy” as materials, industrials and utilities, and the “new economy” as IT, communications and new financials such as private credit and alternative investments, the old economy contributes less than 20% of the S&P’s EPS and the new economy contributes greater than 60%. Stock buyback programs have also contributed to growth in EPS as the same earnings are spread over fewer shares outstanding.
But why are today’s multiples of EPS higher than historical experience? Cyclically, we have been in a very low-interest rate environment for a long time (since the financial crisis of 2009-2010.) At the same time, inflation has been below historical numbers until the economy was hit by Covid-19 and the government pumped out $6.2 trillion of stimulus. You will recall that the federal reserve members believed that the resulting inflation would be “transitory.” They were wrong. Inflation has remained above its 2% target. Profit margins are higher today, driven by tech dominance. Higher margins justify higher multiples. If margins should fall, this driver diminishes. Investors are expecting the growth in earnings to continue, again, driven by technology, so they are buying future earnings. The question is further complicated by the behavioral factors of TINA (There Is No Alternative) and FOMO (Fear Of Missing Out) which are impactful with retail investors but are also seen with institutional investors. These behavioral tendencies keep investors invested in stocks, even when the multiples are high.
High multiples are a part of a new market regime driven by rapid advances in technology, a sustained period of low interest rates and capital return. There appear to be four important factors to sustaining these high multiples. They are low interest rates (below 5%), profit margins staying above 11%, continued growth in the technology sector EPS (above 15%) and continued stock buyback programs.
WSJ October Survey Results
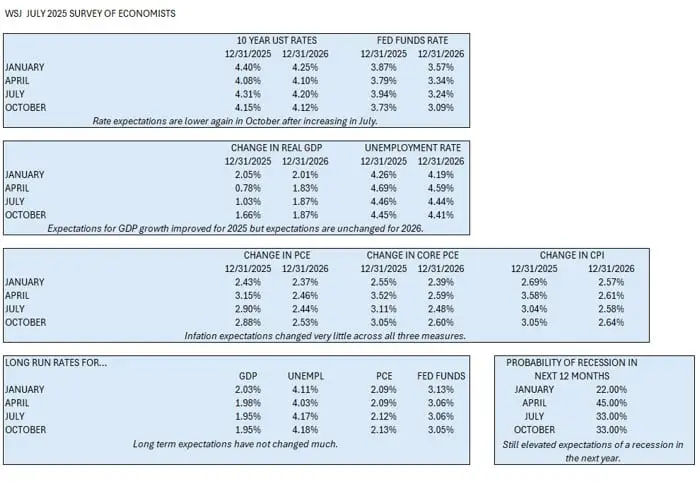
The WSJ survey of economists for the quarter did not show any significant change in the outlook for interest rates, GDP, unemployment, and the chances of recession. See chart below.
Forecasts of the Federal Open Market Committee
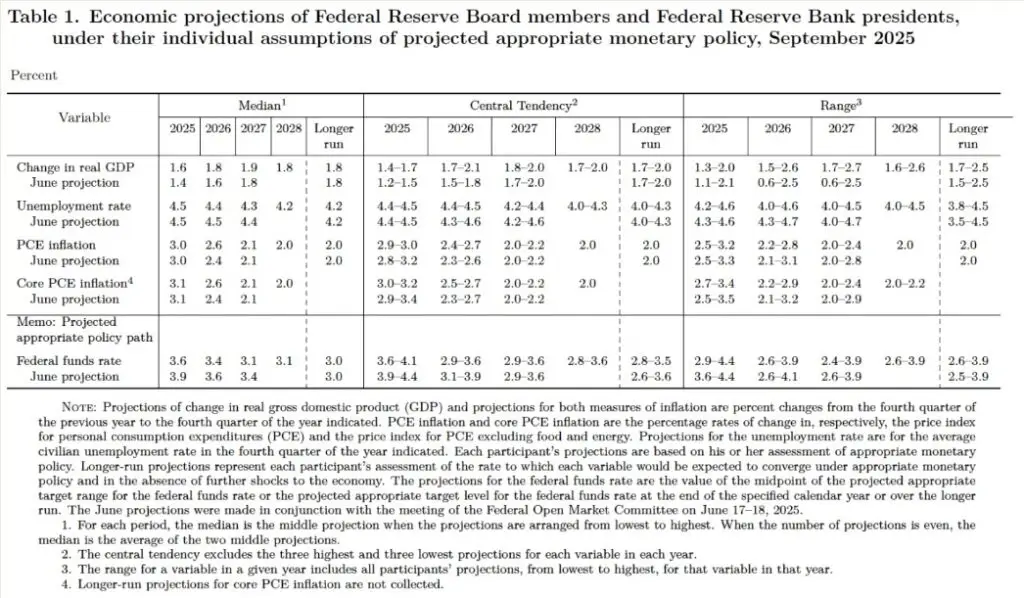
Each member of the Federal Reserve Board Open Market Committee projects their forecast of GDP (Gross Domestic Product), unemployment, interest rates and inflation quarterly. These projections are plotted on a graph commonly called the dot plot. Projected growth in GDP reversed its negative trend with an increase in this estimate in the September survey compared to June. Unemployment and inflation projections did not change but their fed funds rate projection dropped from 3.9% last June to 3.6% in the September survey. Concerns about softening of the labor market drove this and the Fed reduced the fed fund rate target by ¼% on October 29th.
Consumer Sentiment
Consumer sentiment as surveyed by the University of Michigan and The Conference Board has not changed significantly since our last report. The Conference Board reported “Consumer confidence moved sideways in October, only declining slightly from its upwardly revised September level.” Further changes to the individual subcomponents were also limited and largely canceled each other out. The Present Situation Index regained some strength after September’s drop. Consumer’s views of current business conditions inched upward, while their appraisal of job availability improved for the first time since December 2024. On the other hand, all three components of the Expectation Index weakened somewhat.”
The University of Michigan survey produced similar results. ”Consumer sentiment was little changed this month. Current personal finance inched up while expected personal finance receded.” Their survey of October sentiment released November 7th showed a drop in confidence from 53.6 to 50.3, so we continue to see apprehension among consumers.
Retail sales data is unavailable due to the government shutdown. Speaking of which, I did a little research and did not find any significant economic intermediate or long-term impact from past shutdowns. GDP continued to grow. I did see one forecast for a reduction in holiday sales of about 3% from last year. I believe consumers may feel that way in September, but my personal experience is that after Thanksgiving those credit cards start smoking. We’ll see if that remains true this year.
Conclusions
In summary, it appears that the uncertainty created by tariffs is dissipating. The Fed is challenged by stubborn inflation that is not moving toward its target while the labor market is softening. Still, unemployment remains relatively low. Stubborn inflation with a weakening job market makes the Fed’s job much more difficult. Their task is further complicated by a lack of current data due to the federal government shutdown. Chairman Powell equated it to driving in a heavy fog. Rates have come down but the Fed remains data dependent. Chairman Powell said on October 29th that a further reduction in December should not be a foregone conclusion. Corporate earnings are very healthy, and stock prices have reflected that. There appears to be some economic basis as to why multiples are higher than historical multiples, but only time will test their validity.
Thank you for your continued support of our firm and we wish you a very Happy Holiday Season!
Glossary
The Standard and Poor’s 500, or simply the S&P 500, is a stock market index tracking the stock performance of 500 leading companies listed on stock exchanges in the United States.
The Dow Jones Industrial Average, Dow Jones, or simply the Dow, is a stock market index of 30 prominent companies listed on stock exchanges in the United States. The DJIA is one of the oldest and most commonly followed equity indices.
The NASDAQ (National Association of Securities Dealers Automated Quotations) is a global electronic stock exchange, known for its focus on technology and growth stocks.
PCE stands for Personal Consumption Expenditures. It represents the total spending by individuals and households on goods and services in the U.S. economy. Core PCE excludes food and energy prices. The Federal Reserve favors the PCE (over CPI) because it’s believed to be a more accurate representation of actual consumer spending and tends to show a smoother inflation trend.
Core CPI, or Core Consumer Price Index, is a measure of inflation that excludes food and energy prices.
Gross Domestic Product (GDP) is a monetary measure of the total market value of all the final goods and services produced and rendered in a specific time period by a country or countries. GDP is often used to measure the economic activity of a country or region.
Core PCE and Core CPI are not the same. They differ on methodology.
Fed is the Federal Reserve Board of Governors. They are appointed by the President to promote the effective operation of the U.S. economy.
Q3 means the third quarter of the year (July through September)
This material is for general information only and is not intended to provide specific advice or recommendations for any individual. There is no assurance that the views or strategies discussed are suitable for all investors or will yield positive outcomes. Investing involves risks including possible loss of principal. Together Planning has a reasonable belief that this marketing does not include any false or material misleading statements or omissions of facts regarding services, investments, or client experiences. Together Planning has a reasonable belief that the content will not cause an untrue or misleading implication regarding the adviser’s services, investments, or client experiences. Any economic forecasts set forth may not develop as predicted and are subject to change. Any references to markets, asset classes, and sectors are generally regarding the corresponding market index. Indexes are unmanaged statistical composites and cannot be invested into directly. Index performance is not indicative of the performance of any investment and do not reflect fees, expenses, or sales charges. All performance referenced is historical and is no guarantee of future results.
Market projections or investment growth, including those in examples, are not indicative of future results, should not be considered specific investment advice, do not take into consideration your specific situation, and do not intend to make an offer or solicitation for the sale or purchase of any securities or investment strategies. Investments involve risk, including changes in market conditions, and are not guaranteed. Be sure to consult with a qualified financial advisor and/or tax professional before implementing any strategy discussed herein. Together Planning is a SEC registered investment advisor.