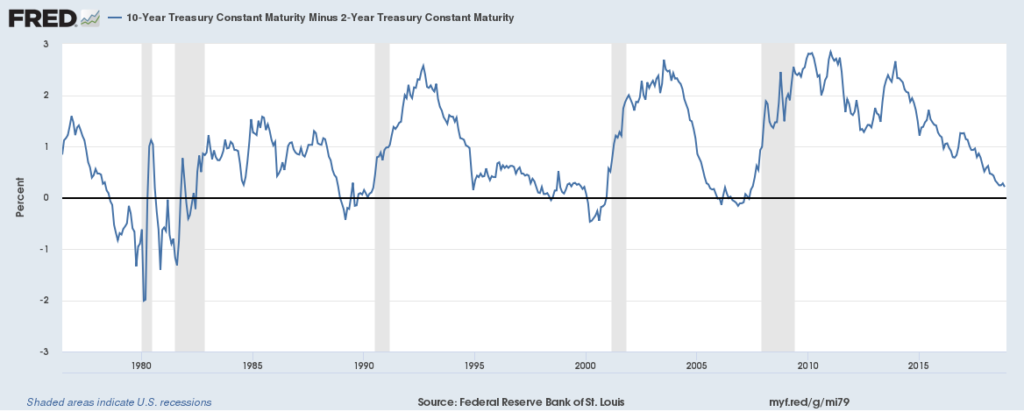
If you watch or listen to market news, you have likely heard analysts mention the flattening of the yield curve, or the possibility of yield curve inversion, as a harbinger of economic recession. It is true that an inverted yield curve has preceded every post-war recession in the U.S., and the last time it happened was in 2007, preceding the financial crisis and a 40% drop in the stock market.
The following chart shows the relationship between yield curve inversions (when the blue line falls below zero) and recessions (the shaded areas).

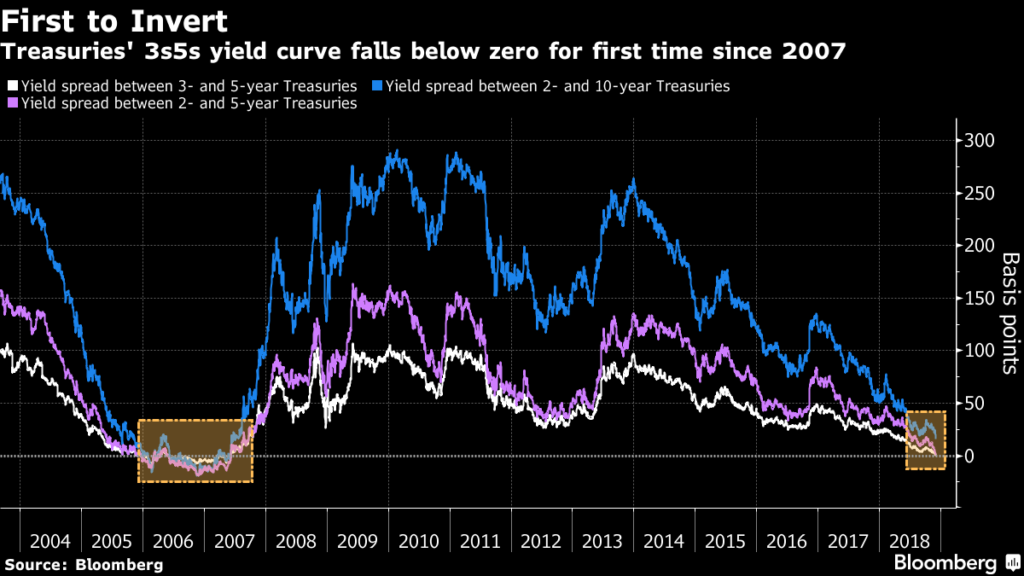
Yesterday, it happened. We saw a yield curve inversion. The yield on a 5-year treasury fell below the yield on the 3-year treasury. This is inversion because the yield on the longer-maturity fell below the yield on the shorter-maturity. This is not the particular part of the curve that most investors watch. The key indicator is the relationship between the 2-year and the 10-year, which is also flattening, and some believe it will invert in the near term. What does that mean?
What is a normal yield curve?
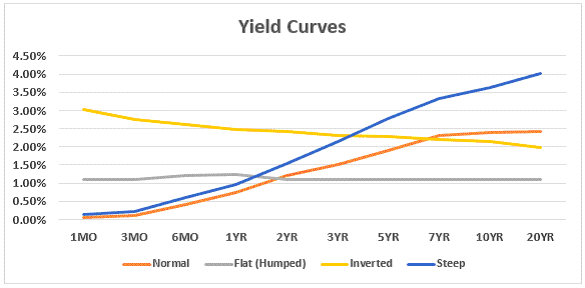
The yield curve is a graphic representation of the relationship between interest rates and time to maturity. It makes sense that longer maturities would carry a higher rate—just like when you apply for a mortgage, the 15-year option has a lower rate than the 30-year. This is because longer terms carry more risk. A normal yield curve looks something like the orange line in the graph below. Yields are higher as maturities are longer. An inverted yield curve looks like the yellow line—yields are lower at the longer maturity periods.

Why would a yield curve invert?
Why would the yield on a longer-term note ever drop below the yield on a shorter-term note? This happens when short-term yields move up or long-term yields move down.
Short-term yields move up when investors no longer want short-term bonds. This is the end of the yield curve that is most impacted by the actions of the Federal Reserve with respect to interest rates. When rates are expected to increase, investors are not willing to pay as much for bonds at the current, lower rates. Prices dip and yields increase.
The other end of the curve, the long-term yields, are more impacted by long-term economic expectations. When a recession is feared, investors start buying safer, long-term investments, driving the prices for those securities up and the yields down.
Where is the 2-year vs. 10-year curve right now?
The spread between the 2-year treasury and the 10-year treasury has not inverted, but it is getting narrower (see how the blue line on the graph below is getting closer to zero). As of this morning it was 15 basis points. The yield on the 2s is 2.83% and the yield on the 10s is 2.98%. Some say that this curve could also invert in the next few months, with the yield on the 2-year going higher than the yield on the 10-year.
Others argue that flattening of a yield curve may not always progress into inversion, and may not necessarily predict recessions. If you are interested in reading more about why it might be different this time, read this article from August 2018 by Jeremy Siegel, the very revered finance professor at Wharton.

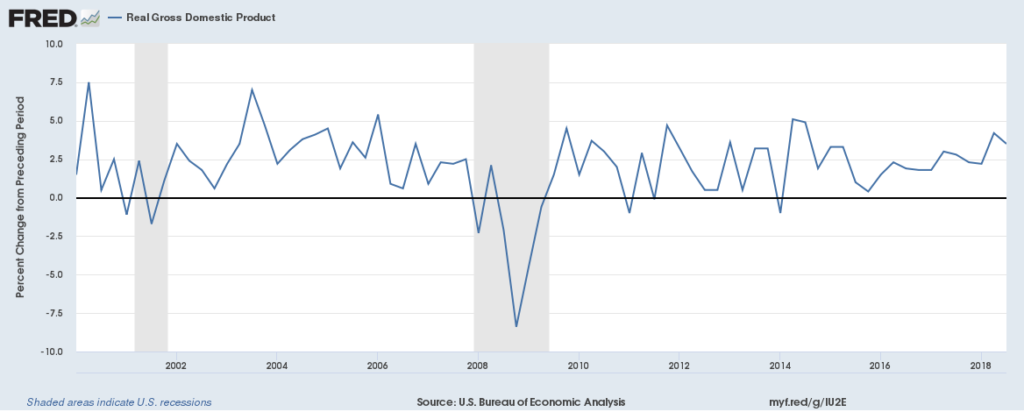
We are not in a recession… yet. A recession is defined as two consecutive quarters of decline in Gross Domestic Product (GDP). GDP continues to grow, as you can see in the chart below. The yield curve inversion is a leading indicator of recessions, so it would come before a recession, maybe by a year or more. Are we a year away from a recession? No one knows. Corporate pre-tax profits are continuing to grow, with a gain of 10.3% over the past year. That profit growth could slow down or reverse at any time, but that will be dependent on fundamentals like consumer demand, and is not directly tied to the yield curve.

Do I need to do anything different with my investments?
Are you invested according to your time horizon? Are you confident that your investment strategy is aligned with your goals? Have you done a financial plan with a fee-only adviser?
While we cannot control things like yields and recessions, we can build investment strategies and financial plans that will succeed through market cycles.
If you have questions about your investments and financial plan, we’d love to speak with you.


